Chauvenet’s Criterion
The following is from
Chauvenet’s Criterion

The procedure assumes your data is normally distributed.
Chauvenet’s criterion is a way to identify outliers. The method works by creating an acceptable band of data around the mean. Eliminate any value that fall outside of the band.
Assuming you have a random sample of n values
- Find the sample's mean (m)
- Find the sample's standard deviation (s)
- Use the following formula to find the standardized deviation
from the mean for each value in the sample
Run the formula n times (One time for each data point).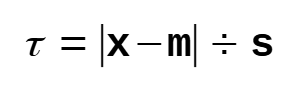
Compare the value you get with the tables of Chauvenet’s criterion below. Reject values that exceed the criterion.
For example if n=30, the table tells us a value's standard deviation should not exceed 2.394. If it does reject it.
If you’ve find an abnormal amount of outliers, you might want to widen the band to include a certain percentage of data points. The empirical rule tells us that 95% of data lies within two standard deviations from the mean. Therefore you should eliminate a maximum of 5% of your data points.
| n | |
|---|---|
| 3 | 1.383 |
| 4 | 1.534 |
| 5 | 1.645 |
| 6 | 1.732 |
| 7 | 1.803 |
| 8 | 1.863 |
| 9 | 1.915 |
| 10 | 1.960 |
| 11 | 2.000 |
| 12 | 2.037 |
| n | |
|---|---|
| 13 | 2.070 |
| 14 | 2.100 |
| 15 | 2.128 |
| 16 | 2.154 |
| 17 | 2.178 |
| 18 | 2.200 |
| 19 | 2.222 |
| 20 | 2.241 |
| 21 | 2.260 |
| 22 | 2.278 |
| n | |
|---|---|
| 23 | 2.295 |
| 24 | 2.311 |
| 25 | 2.326 |
| 26 | 2.341 |
| 27 | 2.355 |
| 28 | 2.369 |
| 29 | 2.382 |
| 30 | 2.394 |
| 31 | 2.406 |
| 32 | 2.418 |
| n | |
|---|---|
| 33 | 2.429 |
| 34 | 2.440 |
| 35 | 2.450 |
| 36 | 2.460 |
| 37 | 2.470 |
| 38 | 2.479 |
| 39 | 2.489 |
| 40 | 2.498 |
| 50 | 2.576 |
| 100 | 2.807 |
| n | |
|---|---|
| 500 | 3.291 |
| 1000 | 3.481 |
Note: Deletion of outlier data is a controversial practice frowned
on by many scientists and science instructors; while Chauvenet's
criterion provides an objective and quantitative method for data
rejection, it does not make the practice more scientifically or
methodologically sound, especially in small sets or where a normal
distribution cannot be assumed. Rejection of outliers is more
acceptable in areas of practice where the underlying model of
the process being measured and the usual distribution of
measurement error are confidently known.
Chauvenet's criterion (Wikipedia)