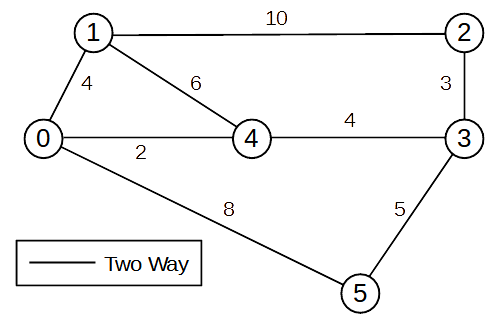
Simpler Cost Diagram (Graph)
Small node-and-cost diagram (graph)

Compact Cost Matrix (only outbound connections)
costs = [ [0, [(4,2),(1,4),(5,8)], "home"],
[1, [(0,4),(4,6),(2,10)], None],
[2, [(3,3),(1,10)], None],
[3, [(2,3),(4,4),(5,5)], "work"],
[4, [(0,2),(3,4),(1,6)], None],
[5, [(3,5),(0,8)], "shopping"] ]
Note:
•The cost data is a list of lists. It defines outbound
connections between nodes. (source node (row ID) to
destination node.)
•In each row:
1. The first item is a row index (node ID). It is
redundant and not used. It is there to make the
data easier for humans to read.
2. Next is a list of tuples. They are a list of outbound
connections (node and cost).
•The tuple's first item is a destination node id.
•The tuple's second item is the connection's cost.
3. The last item in the row is a node name/description.
Only important nodes have names.
# ---- display cost matrix ------------------------------------------
def display_costs_matrix(costs,title=None):
if title is not None:
print(f'title: {title}')
for node in costs:
print(f'node # {node[0]}')
for out in node[1]:
print(f' outbound connection: node={out[0]} cost={out[1]}')
if node[2] is not None:
print(f' name: {node[2]}')
# ---- sort the cost matrix by connection costs ---------------------
# ---- if it is not already sorted -------------------------
new_costs = []
for idx,data in enumerated(costs):
sorted_by_cost = sorted(data[1], key = lambda c: c[1])
print(f'[{idx}] {sorted_by_cost}')
new_costs.append([ data[0], sorted_by_cost, data[2] ])