Project #1

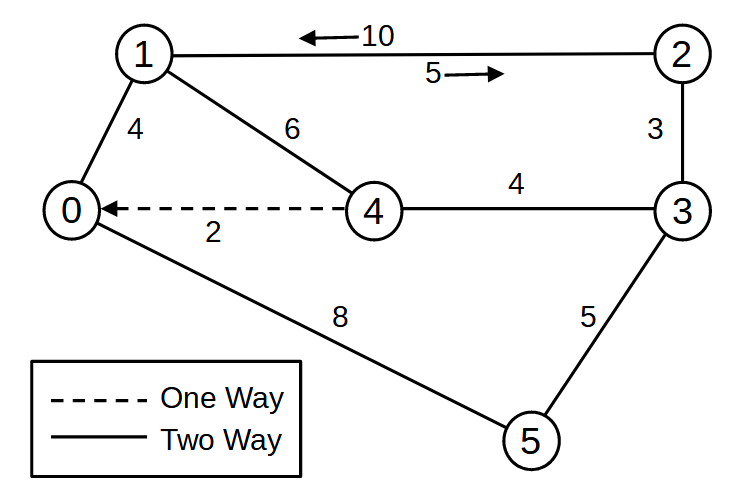
Create a compact cost matrix of the diagram and write it a file so it can be read and used by other programs. (CSV? JSON? ...)
This diagram (graph) is a hypothetical freeway system with construction on one link slowing traffic in one direction. Another links has no connection in one direction. (detour?)
Why save it to a file?
Suppose you are doing this for a large metropolitan area.
The compact cost matrix should have the following format
| item | description |
|---|---|
| 0 | row (node) index (redundant and not used.) it is there to make it easier for humans to read the data. |
| 1 | a list of outbound connections. it contains outbound (destination) nodes and their node-to-node costs. |
| 2 | node name if any (just for important nodes.) |
The compact cost data is from-node (row index) --> to-node (column index). The graph designer only needs to think about outbound connections.
The matrices are from-node (column) --> to-node (row). This is especially useful for the minimum paths matrix. All of the minimum paths to a given node are in a single row. You don't need to bounce around inside of a 2D matrix.
Project #2
Write a program that reads a compact cost matrix file and creates a regular cost matrix. (Put this in a function so it can be used by other programs?)
Programming hint: create a 2D matrix filled with -1. Next fill it with costs from the compact cost matrix data.
Project #3a
Create a program that uses Dijkstra's algorithm and the data generated in Problem #2. Create a 2D minimum path matrix. Save it to a file?
There are many descriptions of the algorithm on the web and also many code examples on on the web. Use (and modify) the algorithm to create a minimum path matrix.
Display the minimum path matrix in a pretty way. (See this project's root page.)
Project #3b
Calculate an accumulative (node-to-node) cost matrix.
Display the accumulative (node-to-node) cost matrix in a pretty way. (See this project's root page.)
Project #4
Generate a random 2D graph with at least 50 nodes.
- each node has 2 to 4 outbound connections (or 1 connection as long is not a one way connection)
- there a few one way connections (5%?)
- the connection cost of a few of them is not the same in both directions (2%?)
- the cost of each node-to-node connection is randomly generated (1 to 20?)
Testing hint: Test using 4 or 5 random nodes (use a seed) until it is working. Lastly generate a big one.
This is not required. The locations (coordinates?) for each node could also be randomly generated. How do you draw/plot this diagram (graph)?
Project #5
Do it all over again in 3D. (Create a 3D cost matrix.)