
Project #1
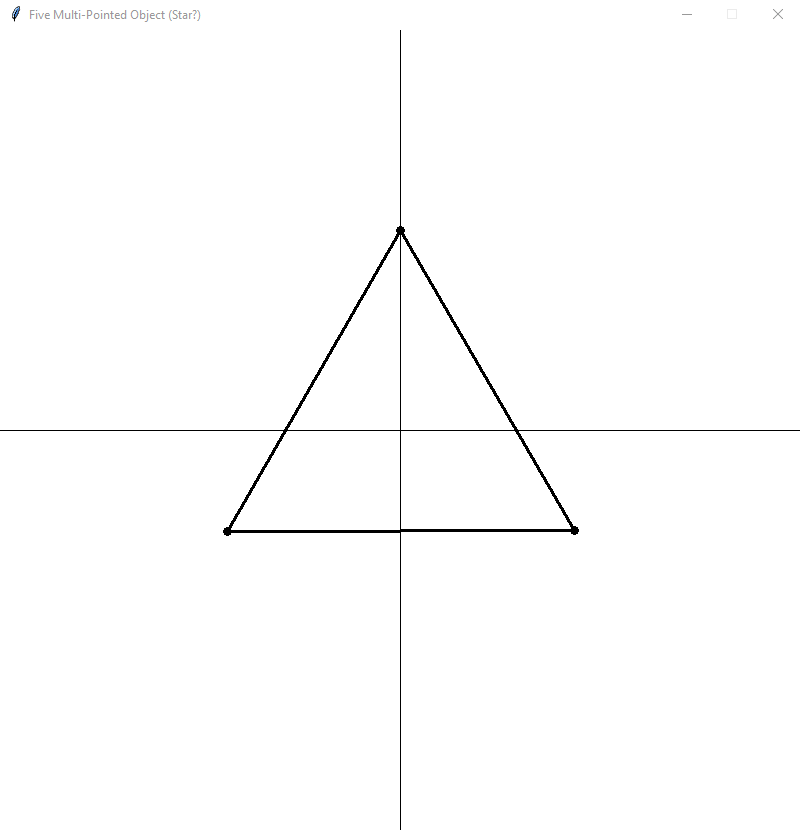
Create an interactive program to draw the multi-pointed shapes like the ones shown below in the examples. Notice that lines are drawn between two points.
Points are 200px from the origin (0,0) and spaced evenly around the origin. They are stored in order (clockwise or counterclockwise) in a list.
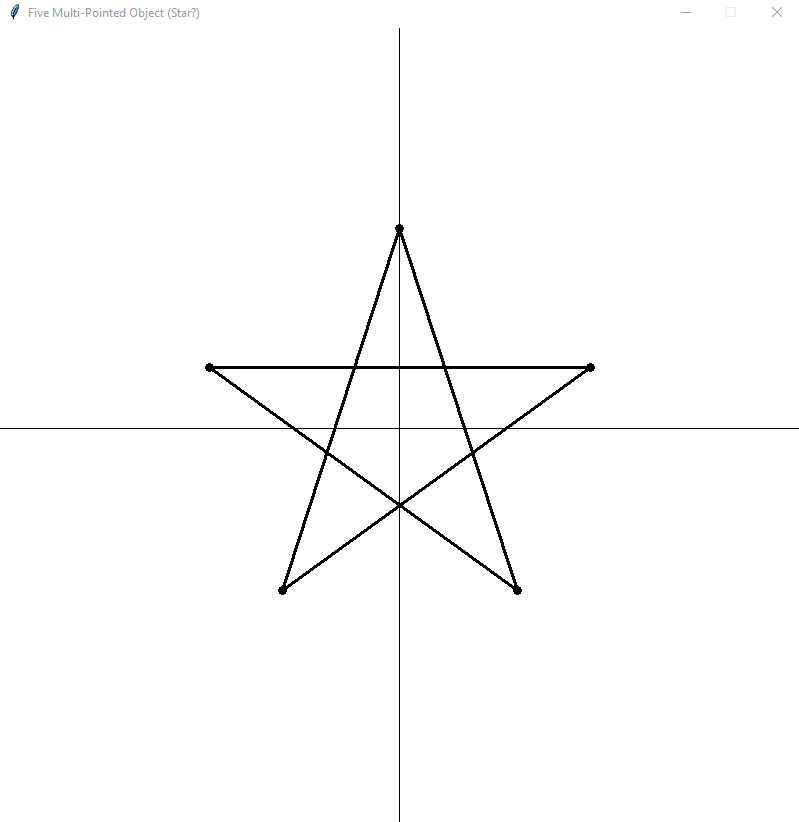
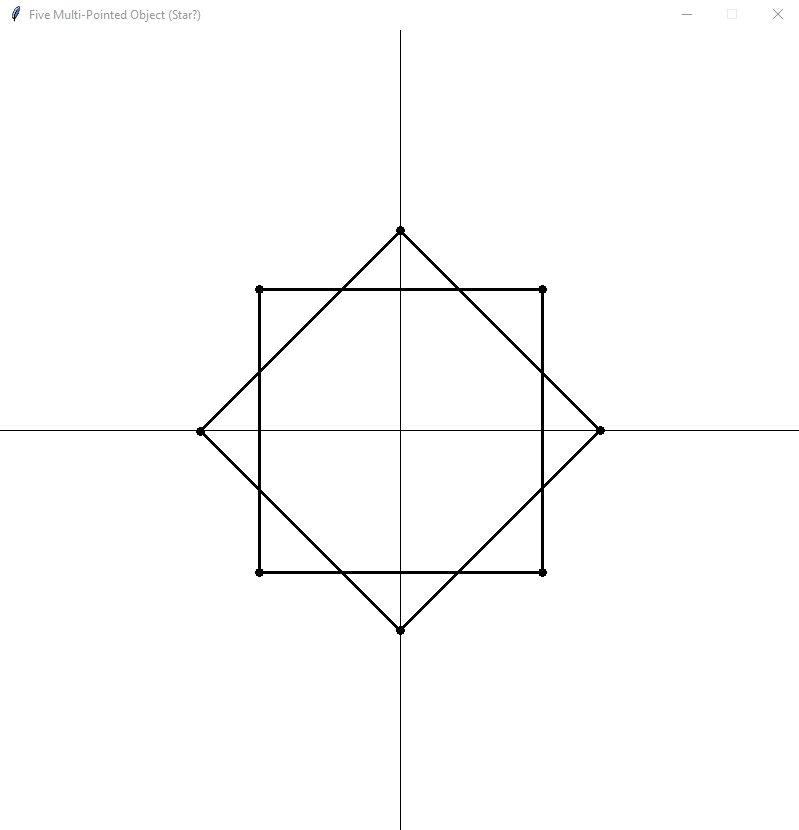
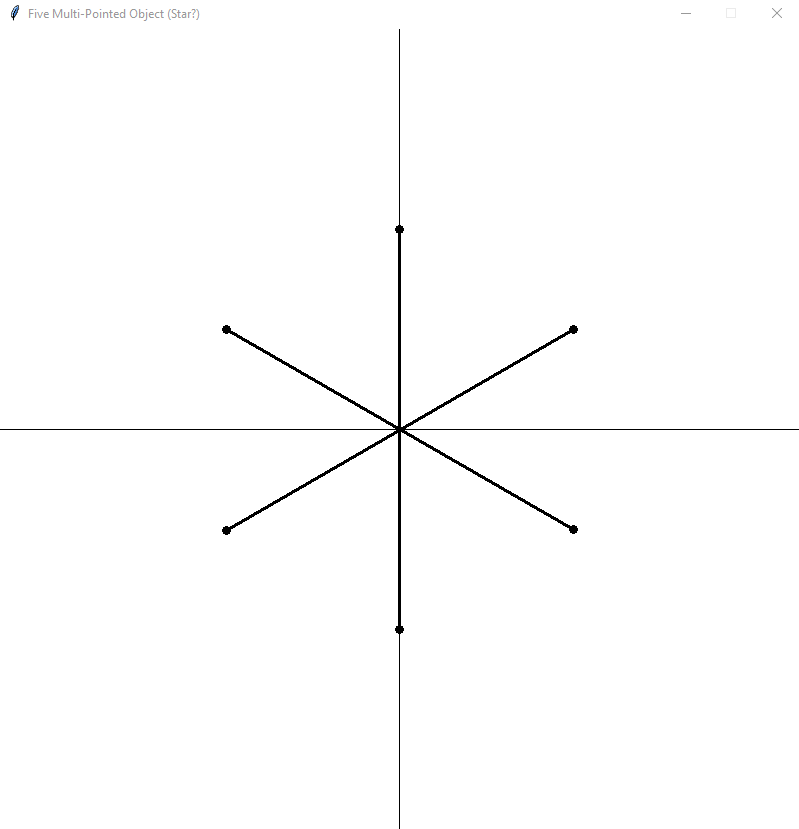
The examples show skipping 0,1,2, ... points when drawing the lines.
A possible program structure
- Create a graphics window
- loop
- ask the user for for the number of points
- ask the user for the number of points to skip when drawing a line
- draw the graphics object
- calculate the point's xy coordinates
(store them in order in a list) - clear the graphics window
- draw the points
- draw the lines (p[i] to p[i+1+skip])
(every point is a starting point and an ending point) - stop drawing lines when the "next" starting point
is the same as the first starting point
- calculate the point's xy coordinates
Some things to think about
- Every point is a starting and an ending point
- one way is to use indexes (0,1,2,3,...) to access the points
- use the mod ('%') operator to make sure the point
indexes do not exceed the length of the list - another way is to create a list of lines instead of points
- the skip count must be less than half the length of the list-of-points
- limit the points to a minimum of 2 and a maximum of 20
Project #2
Modify project #1
Increase the maximum number of points (30, 40, 50 ...).
Allowing the user to
- change the point to origin (0,0) distance.
(define a max/min?) - do not draw the line; draw the midpoint of each line.
(draw a small circle?) - select the color of the midpoints.
(red, yellow , green, cyan, blue, magenta)
Menu driven? GUI driven?
What shape are you approximating?
Draw several midpoints in a row the same color, then randomly change
the the color for the next set of midpoints?
Examples
3 points skip 0
5 points skip 0

7 points skip 0

5 points skip 0
7 points skip 0
5 points skip 1
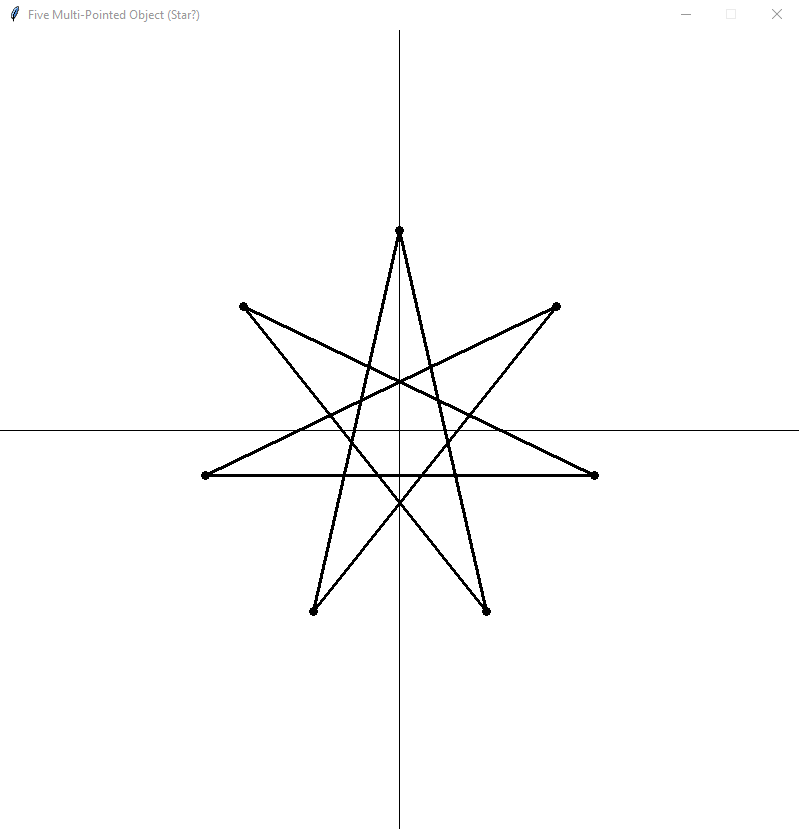
7 points skip 1

8 points skip 1
7 points skip 1
8 points skip 1
6 points skip 2
7 points skip 2
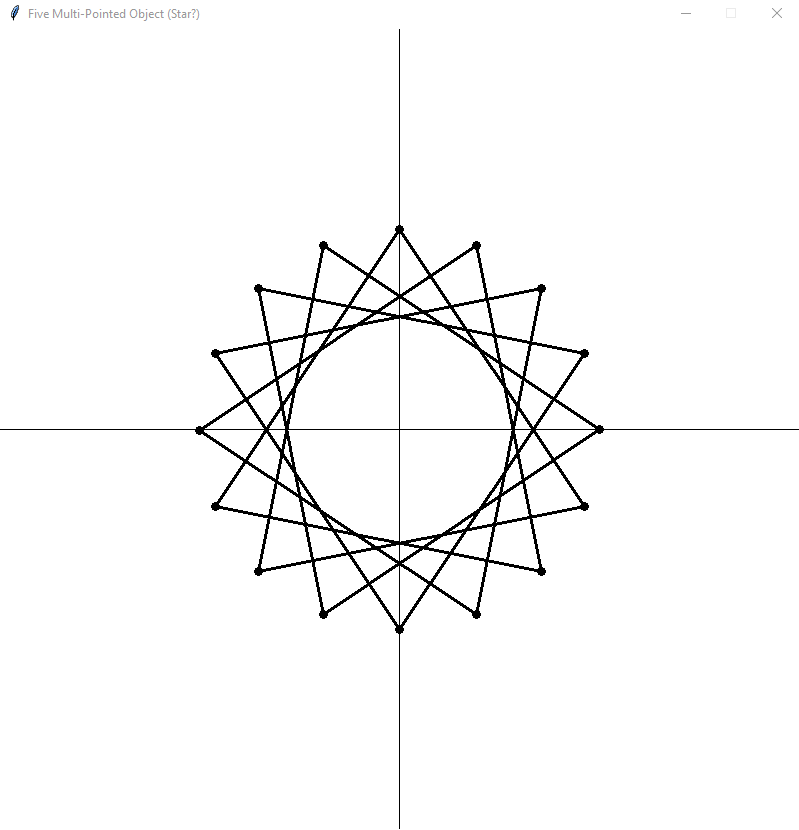
16 points skip 4
7 points skip 2
16 points skip 4