Introduction
This is not a course in statistics. It is an introduction to a simple linear regression methodology. There is a lot more to learn about statistics and regression, but not here.

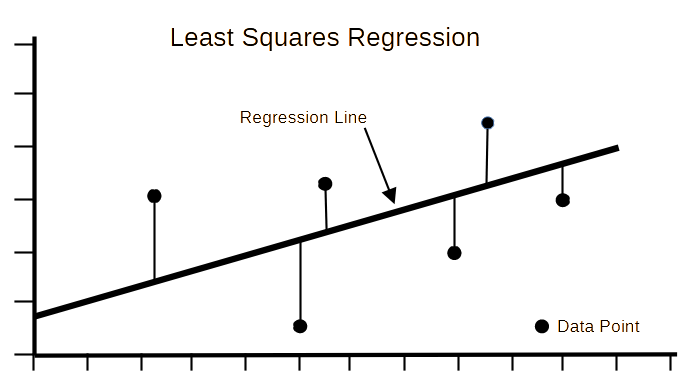
The diagram shows the data points that were measured/collect for analysis.
The regression line is a theoretical line describing the data points. If the data was perfect the data points would fall directly on the line. Because the data is not perfect, mathematical methods (e.g. least squares regression) can be used to find the Line-of-Best-Fit. The line minimizes the sum of the distances from data points to the theoretical perfect line.
The point of all of this is to get the equation for the perfect line that can be used to predict other (dependent) values.
We can also measure how badly the data points fit the perfect line. However, that problem is not part of this project.
Do not use any existing Python modules, etc. Use/code the equations show below.
Project #0
Create test data for Project #1.
One way is to use this code
Another way is to use data from one of the following
10 open datasets for linear regression
To plot the data I suggest you use the pyplot or related modules.
matplotlib.pyplot
 . (documentation and examples)
To see more random data generation
and pyplot examples click
HERE
 .
.
Data Assumptions
There are limitations when using the Least Squares method.
- It only defines the relationship between the two variables.
Other causes and effects are not considered. - The variables measured should be continuous.
For example time, sales, weight, test scores ... - Observations should be independent of each other.
There should be no dependency. - It is unreliable when data is not evenly distributed.
- Data should have no significant outliers.
Project #1
In this project, you will run a simple demo of regression analysis using the Least Squares method. Create a program to
- Read x,y data points from a file.
- Find the theoretical perfect line.
- Plot the data points and the line.
To plot the data I suggest you use the pyplot or related modules.
matplotlib.pyplot
 . (documentation and examples)
To see more random data generation
and pyplot examples click
HERE
 .
.
Equation of a Line
The 'x' (independent variable) values are used to calculate the 'y' (dependent variable) values. In other words, using the equation, 'x' can be used to calculate 'y'.
 y: dependent variable
m: the slope of the line
x: independent variable
b: y-intercept
Steps to Calculate the Line-of-Best-Fit
The following steps calculate the values of slope and y-intercept for the Line-of-Best-Fit (the regression line).
You can use the following two tests to verify your code is working correctly. Then use the data you generated.
Programming hint
Step 1: Calculate the slope 'm'
 y: dependent variable
x: independent variable
n: number of data points
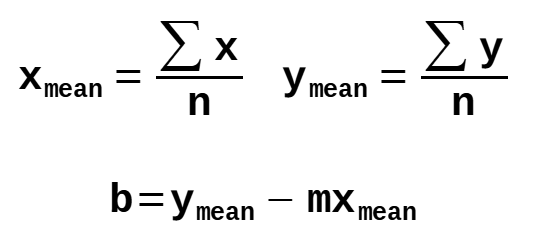
Step 2: Calculate the y-intercept
The 'y' value where the line crosses the y-axis. (i.e. x = 0)
 y: dependent variable
m: the slope of the line
x: independent variable
b: y-intercept
Step 3: Substitute the values to get the final equation
 y: dependent variable
m: the slope of the line
x: independent variable
b: y-intercept
Definitions
| Math Term | Definition |
|---|---|
| Dependent variable | a variable (often denoted by y) whose value depends on that of another. |
| Independent variable | a variable (often denoted by x) whose variation does not depend on that of another. |
| Least Squares Regression |
The Least Squares Regression Line is the line that minimizes the sum of the residuals squared. The residual is the vertical distance between the observed point and the predicted point, and it is calculated by subtracting Ypredicted from Yobserved. |
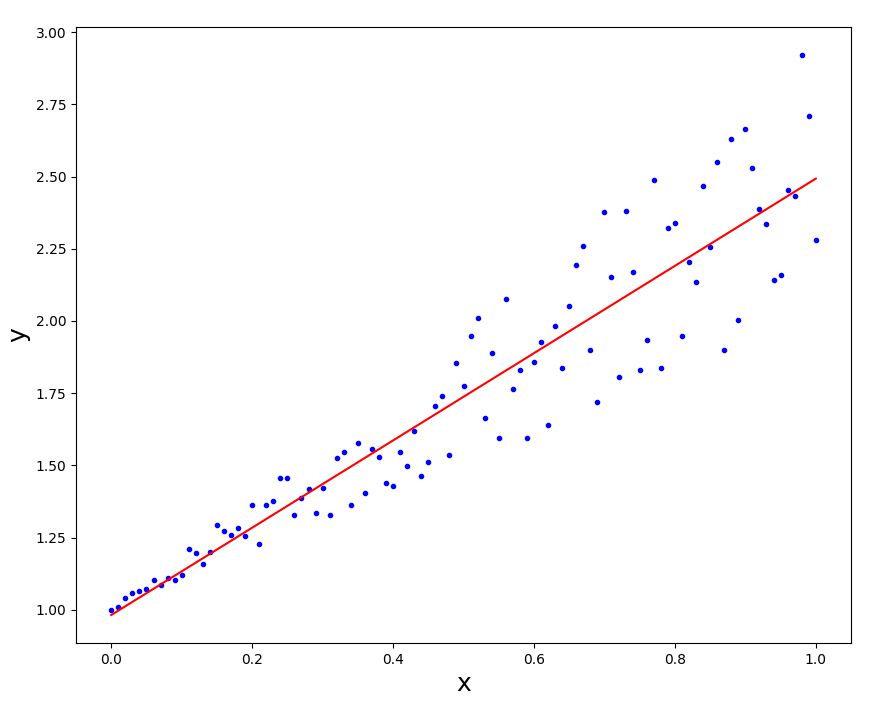
Example Plot

Links
A 101 Guide On The Least Squares Regression Method
Linear Regression Algorithm In Python From Scratch [Machine Learning Tutorial] (YouTube)
Least Squares Regression in Python
Solving Linear Regression in Python
Linear regression (disambiguation) (Wikipedia)