YOU CAN RELAX. THIS IS NOT A MATH PROBLEM. YOUR JOB IS TO CODE THE EQUATIONS GIVEN AND PLOT THE RESULTS.
Introduction
Fourier series is a technique of decomposing a periodic signal into a sum of sine and cosine terms.
A Fourier series is an expansion of a periodic function into a sum of trigonometric functions. By expressing a function as a sum of sines and cosines, many problems involving the function become easier to analyze because trigonometric functions are well understood. (Wikipedia)
| Define | Description |
|---|---|
| harmonic |
A harmonic is a wave or signal whose frequency is an integral (whole number) multiple of the frequency of a reference signal or wave. |
| periodic functions | Periodic functions are functions that repeats its values at regular intervals or periods. They are used to describe oscillations, waves, and other phenomena that exhibit periodicity. |
Note: The difference between the Fourier transform and the Fourier series is that the Fourier transform is applicable for non-periodic signals, while the Fourier series is applicable to periodic signals.
Project #1
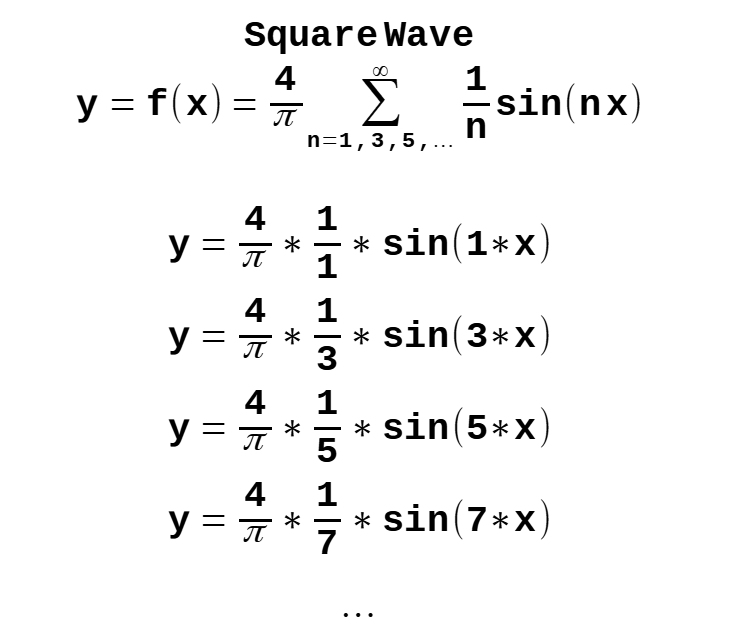
Create an interactive program that allows the user to generate a Fourier series to approximate a square wave. (See the square wave equation below.)
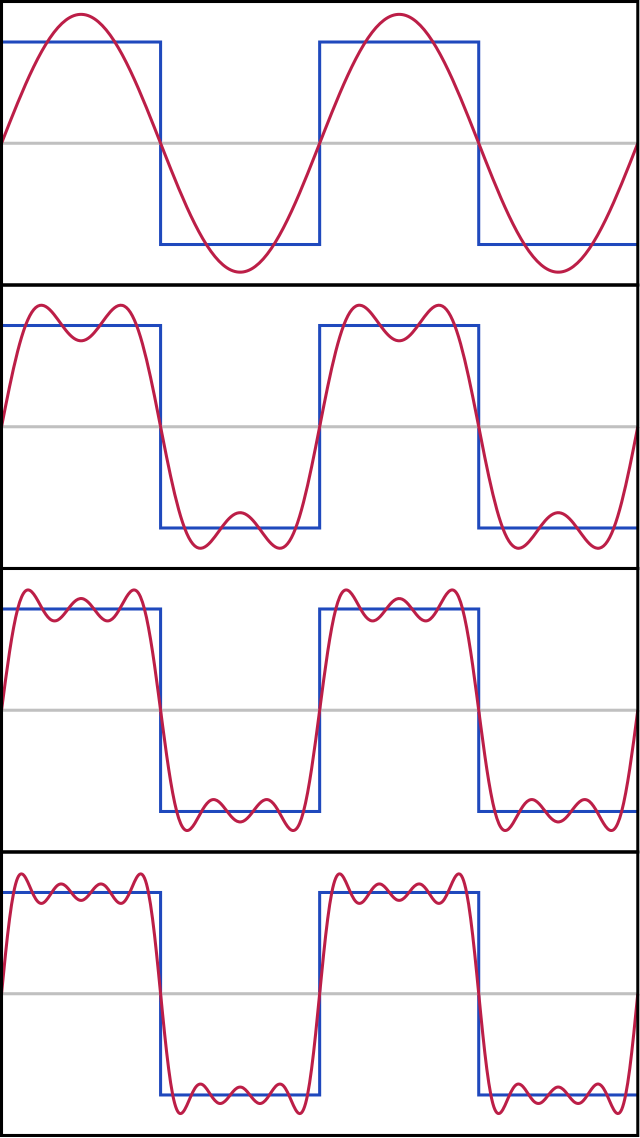
Note, as you add more harmonics (sine/cosine waves), the approximation improves.
The program should allow the user to
- selects the number of harmonics to include in the calculation of Y
- plot the results of a Fourier series
- plot X: -180 to 180 degrees (step 2)
- scale Y: Y*100
Use one graphics window. "Erase" any existing plot data before drawing the next plot data.
Use graphics.py.
It is a simple graphics library.
Click HERE
 for more information.
(download, install, documentation, ...)
A suggestion for the graphics window
- height 801
- width 801
- draw X and Y axes
- origin (0,0) of the Cartesian coordinates is the center of the graphics window
Square Wave Example
As you can see the more harmonics that are added the better the approximation.

Image From: commons.wikimedia.org
Project #2
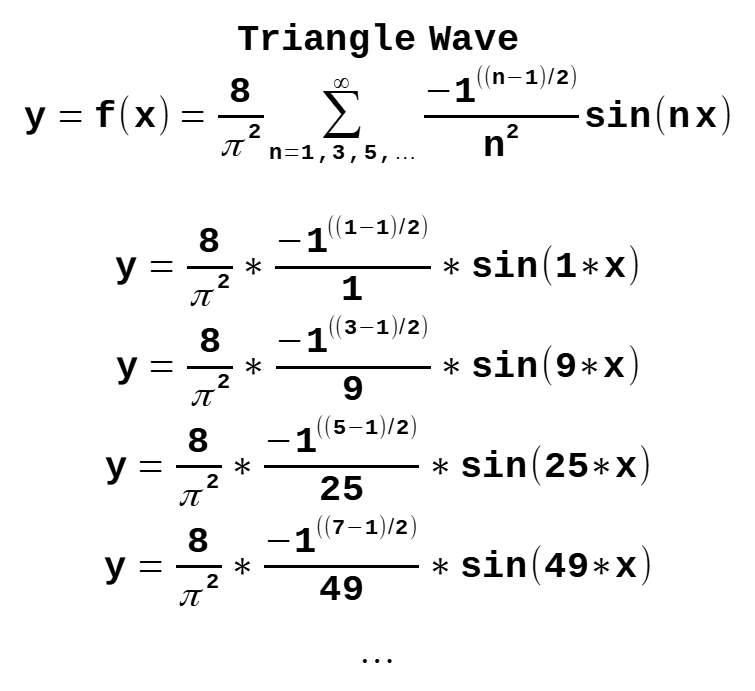
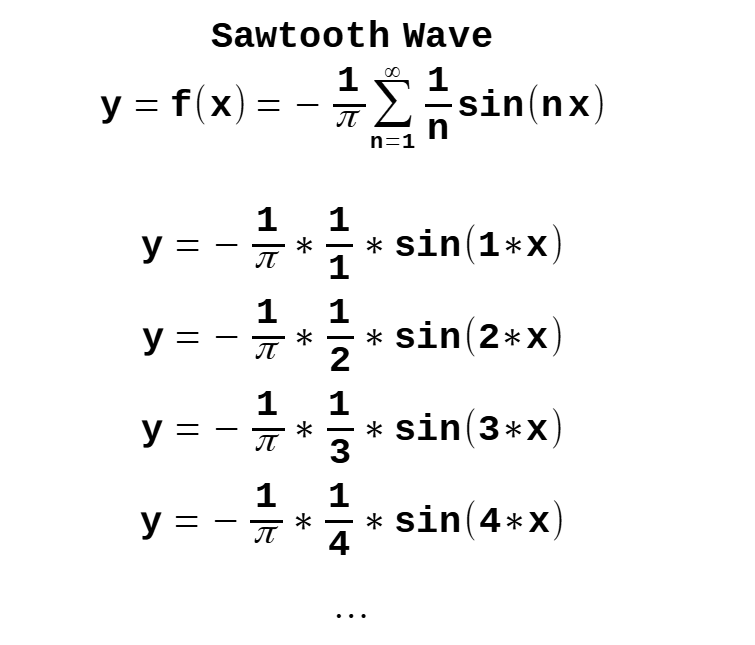
Add to project #1. Let the user choose between a square wave, sawtooth wave, or a triangle wave. (See the equations below.)
Square Wave Equation

Triangle Wave Equation

Sawtooth Wave Equation

Links
Fourier Series (Wikipedia)
FFT of square wave - what does output represent?
FYI
The Remarkable Story Behind The Most Important Algorithm Of All Time (YouTube)