Introduction
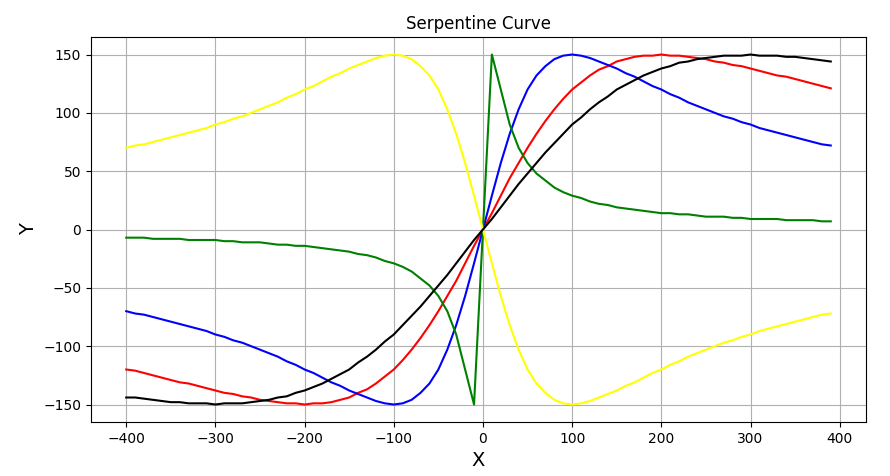
The serpentine curve is a cubic curve as described by Isaac Newton, given by the Cartesian equation y(a**2 + x**2) = abx. The origin is a point of inflection, the axis of x being an asymptote and the curve lies between the parallel lines 2y = ±b. (Wikipedia)
import matplotlib.pyplot as plt
# ---- serpentine function - return y coordinate
def serpentine_func(x,a,b):
y = (a*b*x)/(a**2 + x**2)
return int(y)
# ---- main
a1 = 200
a2 = 100
a3 = 10
a4 = -100
a5 = 300
b = 300
y1 = []
y2 = []
y3 = []
y4 = []
y5 = []
x1 = []
# ---- calculate integer X,Y coordinates
for x in range(-400,400,10): # X coordinate
# ---- x1
x1.append(x)
# ---- a1 red
y1.append(serpentine_func(x,a1,b))
# ---- a2 blue
y2.append(serpentine_func(x,a2,b))
# ---- a3 green
y3.append(serpentine_func(x,a3,b))
# ---- a4 yellow
y4.append(serpentine_func(x,a4,b))
# ---- a5 black
y5.append(serpentine_func(x,a5,b))
# ---- add to plot - x,y axes - axis annotation - etc.
...
# ---- plot curves
plt.plot(x1,y1)
plt.plot(x1,y2)
plt.plot(x1,y3)
plt.plot(x1,y4)
plt.plot(x1,y5)
plt.show()