 (Wikipedia)
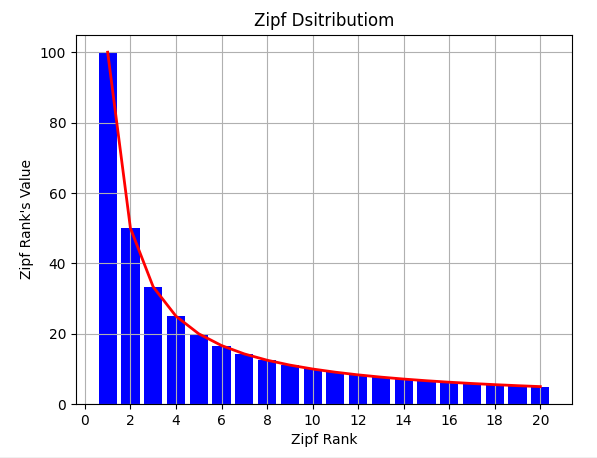
The red line and the blue bars are the theoretical
Zipf distribution. (1, 1/2, 1/3, 1/4, ..., 1/n)
Example of Zipf Distribution
#!/usr/bin/python3
# =============================================================
# Zipf distribution (Zipf's law)
#
# Note: Rank is a position in the hierarchy.
# (i.e. first, second, third, ...)
# =============================================================
import matplotlib.pyplot as plt
zipf_max = 100.0
zipf_size = 20
# ---- zipf distribution values (1, 1/2, 1/3, 1/4, ..., 1/n)
zipf_list = []
for i in range(1,zipf_size+1):
zipf_list.append(zipf_max/i)
##print(f'i={i} {zipf_max/i}')
# ---- plot zipf distribution
plt.title('Zipf Distribution')
plt.xlabel('Zipf Rank')
plt.ylabel('Zipf Rank Value')
plt.xticks([i for i in range(0,len(zipf_list)+1,2)])
plt.grid()
x = [i for i in range(1,len(zipf_list)+1)]
plt.plot(x,zipf_list,linewidth=2,color='r')
plt.bar(x,zipf_list,linewidth=8,color='blue')
plt.show()
Example of Zipf-Mandelbrot Distribution
Basically the same results as Example #1 but using different math.
#!/usr/bin/python3
# =============================================================
# Zipf-Mandelbrot law
#
# Note: Rank is a position in the hierarchy.
# (i.e. first, second, third, ...)
# =============================================================
# From Zipf's Law (Wikipedia)
#
# Zipf-Mandelbrot law:
# word_frequency = 1/((rank+b)**a)
# or
# word_frequency = 1/pow((rank+b),a)
# with
# a approximately 1.0
# b approximately 2.7
# =============================================================
import matplotlib.pyplot as plt
zipf_max = 100.0
zipf_size = 20
a = 1.0
b = 2.7
# ---- Zipf-Mandelbrot frequency values
# ---- scale frequency values to 'zipf_max'
# ---- Note: zipf_max should be the first element in
# ---- zipf_list counts decrease from there
freq_list = []
zipf_list = []
for i in range(1,zipf_size+1):
freq = 1/pow(i+b,a)
freq_list.append(freq)
zipf_list.append(zipf_max*(freq/freq_list[0]))
##for r,f in enumerate(freq_list,start=1):
## print(f'rank={r:<2} freq={f:6.4f} ' +\
## f'value={zipf_list[r-1]:=8.4f}')
# ---- plot zipf distribution
plt.title('Zipf-Mandelbrot Distribution')
plt.ylabel('Zipf Rank Value')
plt.xlabel('Zipf Rank')
plt.xticks([i for i in range(0,len(zipf_list)+1,2)])
plt.grid()
rank = [i for i in range(1,len(zipf_list)+1)]
plt.plot(rank,zipf_list,linewidth=2,color='r')
plt.bar(rank,zipf_list,linewidth=8,color='blue')
plt.show()