Based on the YouTube video What is 0 to the power of 0?. (YouTube)
Watch the video before proceeding.
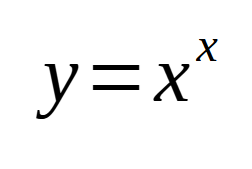
Project #1
Plot the following equation using the X values below. Add extra X values to smooth the curve.
# ---- x values
x = [ 1.0, 0.9, 0.8, 0.7, 0.6, 0.5,
0.4, 0.3, 0.2, 0.1, 0.05, 0.02,
0.01, 0.001, 0.0001, 0.00001,
0.000001, 0.0000001 ]
Use matplotlib.pyplot (documentation and examples)
Create the plot with a title, xlabel, ylabel, and grid.
Links
Exponents in Python: A Comprehensive Guide for Beginners
Why is 0! = 1? (YouTube)
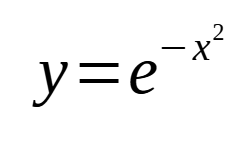
Project #2
Plot this equation (Gaussian function).
Create the plot with a title, xlabel, ylabel, and grid.