Project #1
Create a simple software analog gauge.
- Keep it simple to start with. No fancy borders, etc.
- This is a demonstration only. We will not be connecting the gauge to any real data source.
- I recommend using a user interface (menu) to drive the gauge. For example, you could use this example code.
- A real analog gauge does not change values (where it points) instantaneously. There is a slight lag time when the gauge moves from one position to another.
Project #2
Create a simple dashboard with analog and digital displays.
Project #3
Connect the dashboard to a real data source or sources. For example, disk space usage, CPU usage, a thermometer, ...
Graphics Library
For this project, use graphics.py.
It is a simple graphics library.
Click HERE
 for more information.
(download, install, documentation, ...)
One alternative to graphics.py is tkinter. Graphics.py is a wrapper around tkinter but is simpler to use. tkinter comes pre-installed in Python3, and is a more complex and capable graphics library.
(FYI: You don't need to know this to use it but... Tkinter is a set of Python bindings for TCL/TK.)
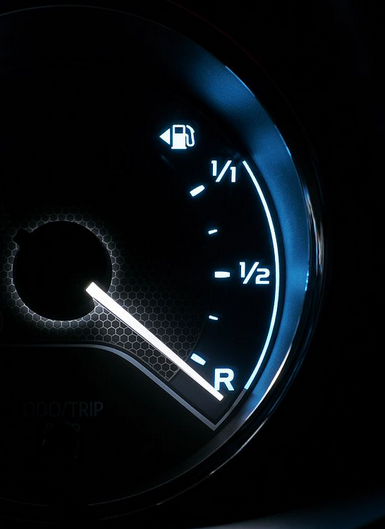
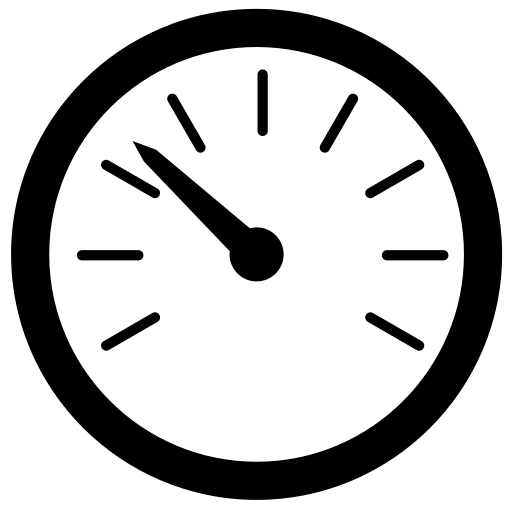
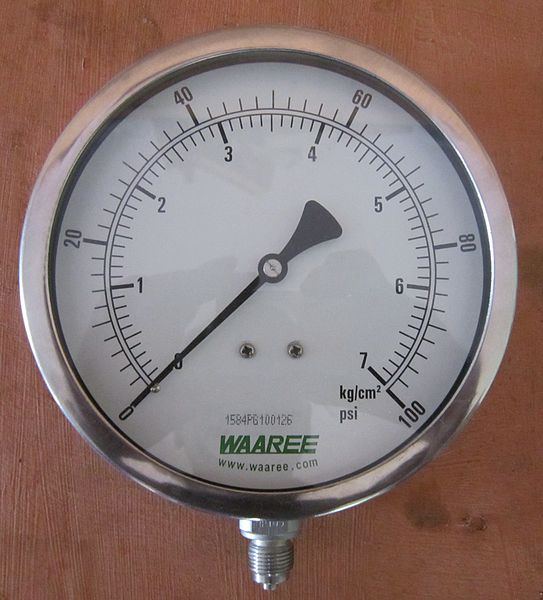
Examples of Analog Gauges


images from commons.wikimedia.org