Graphics Library
Use graphics.py. For more information click HERE
 . (download, install, documentation, etc.)
Project #1
Read the Star Catalog and create a CSV files. (One star per line.)
Calculate the XYZ coordinates of each star from its galactic lat/lon.
Each line in the CSV file should have (at a minimum)
- galactic lat/lon
- XYZ coordinates
- the star's name (if any)
- a flag indicating a double/multiple star
To test if you have read the data correctly, create a program that draws every star using their XYZ coordinates. This should generate a sphere of stars around the origin (0,0,0). (Graphics Window 801,801, Sphere radius 300 pixels, Normal stars black, Double/Multiple stars red)
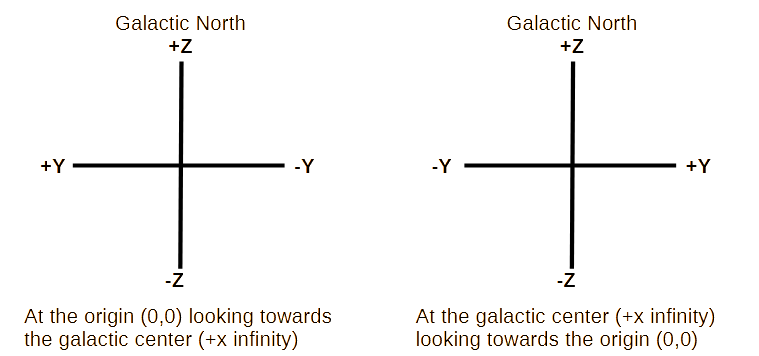
Note: The code examples provided view the sphere of stars from the galactic center (+ infinity) looking towards the origin (0,0,0).
Project #2
Modify project #1. Select one star from each quadrant. (There are 8 quadrants in the XYZ coordinate system.) Draw each star with a different color. Do they appear in their correct position?
Project #3
Modify project #2. Allow the user to rotate the sphere of stars to view it from different angles. (Rotate around X,Y,Z axes.)
Project #4
Write a program to view stars from the data in a star catalog. Use the graphics.py module to display part of the sky in a window.
Obviously there are problems. For example
- View the sphere of stars from the origin (0,0,0) looking toward the galactic center (+X infinity).
- Converting from lat/lon to XYZ coordinates.
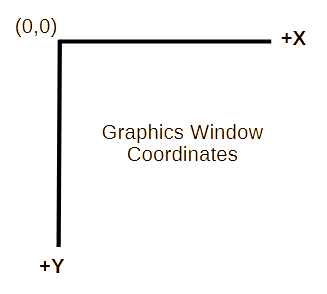
- Mapping 3D XYZ coordinates to 2D window coordinates.
- Scale the part of the sphere of stars (window of stars) we want to view to fit in the graphics window.
- Limiting distortion by limiting the size of the window of stars. Perhaps 20° x 20° (measured at the equator) of the sphere of stars?
- Color the stars to reflect their natural color, size, temperature, ...?
- How does the user control the program? (I suggest using a menu to start with.)
Star Catalog
A location where you can download a star catalog ...
bsc5.dat.gz is the ASCII star catalog data file. (one star per line)
bsc5.readme is the star catalog description (includes the catalog data format).
Extracting data from the catalog records (one line, one star) has some quirks. I suggest you look at Python slice strings. Slice strings are indexed starting with zero (0). The data description indexing starts with one (1). Also slice strings starting index is inclusive and the ending index is exclusive.
| slice index | data description index |
|---|---|
| 0 | 1 |
| 1 | 2 |
| 2 | 3 |
| ... | ... |
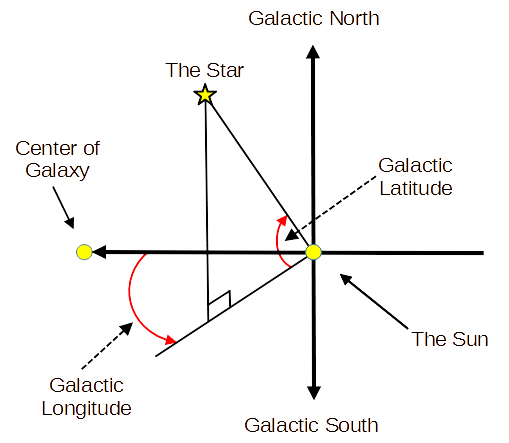
Converting Galactic Latitude/Longitude to X,Y,Z Coordinates
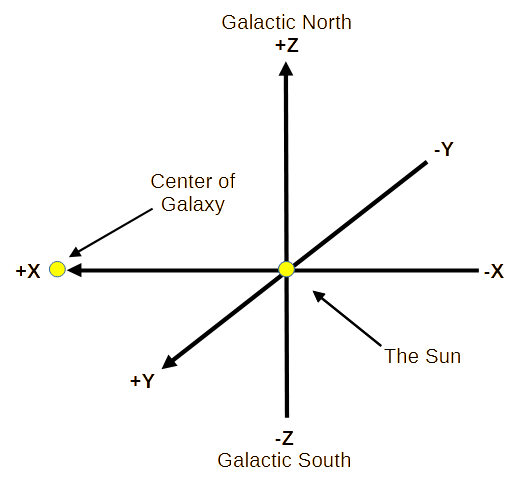
Galactic Longitude is measured from an imaginary line drawn from the sun to the galactic center. It is a 0° to 360° angle. It is a counter-clockwise angle when looking down from the galactic north pole. (From the sun towards the galactic center defines the +X axis.)
Galactic Latitude is measured from the imaginary plane of the galaxy. Its value can vary between +90° to -90°. It is a counter-clockwise angle when looking from the galactic center towards the Sun. (Galactic north pole is the +Z axis.)
The "Right Hand Rule" defines the direction of the +Y axis.
See
Galactic coordinate system (Wikipedia)
Galactic Coordinate System
Drawing stars in a 3D space
Using galactic latitude and longitude, stars appear as a sphere around the sun. For this project the Earth and the Sun are one.
Using a star's latitude and longitude we can calculate the X,Y,Z coordinates of each star with the Sun in the center (coordinates origin).
the right hand rule
Note: In the following equations the abbreviations lat and lon will be used.
From Converting from longitude\latitude to Cartesian coordinates
Lat/lon define the location of stars as a sphere around the sun. Using the equations we can find each star's XYZ coordinates on that sphere. The sphere has a radius of one (1).
Notes on Galactic Latitude and Longitude
| North Pole | +90° latitude |
| South Pole | −90° latitude |
| Galactic Center | 0° longitude |
| Anti-center | 180° longitude |
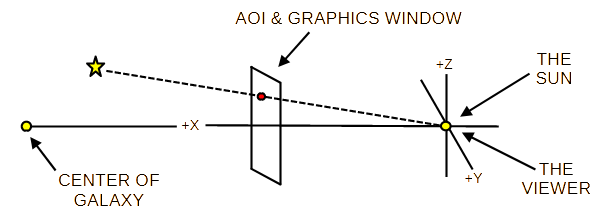
The AOI / Graphics Window
Design?
Using the stars galactic Lat/Lon ...
- The user selects a galactic lat/lon as a Point of Interest (POI).
- The POI is used to defines the center of an Area of Interest (AOI). Limit the size of the AOI (perhaps 20° x 20°) to minimize the parallax and other distortions.
- Select the star in the AOI using their galactic lat/lon.
- Use the X,Y,Z coordinates to draw the selected stars in the graphics window.
This only works near the equator. In higher latitudes and especially the poles, defining an AOI is a problem using lat/lon.
Using the stars XYZ coordinates ...
The following used XYZ coordinates to eliminate the "pole problem".
- The user selects a galactic lat/lon as a Point of Interest (POI).
- The POI is used to defines the center of an Area of Interest (AOI). Limit the size of the AOI (perhaps 20° x 20°) to minimize the parallax and other distortions.
- Get the POI's XYZ coordinates.
- Create a transformation matrix to rotate The POI so it is on the +X axis.
- Assume the viewer is at the origin looking at the galactic center.
- Transform and calculate the AOI's XYZ limits.
- Test every star to see if it is in the AOI.
- Only stars with a positive X coordinate are eligible for selection.
(-X coordinates are behind the viewer) - Transform (rotate) every star and select the stars in the AOI.
(Use XYZ coordinates to select stars)
- Only stars with a positive X coordinate are eligible for selection.
- Use the X,Y,Z coordinates to draw the selected stars in the graphics window.
For a program to test lat/lon conversion to X,Y,Z
click HERE
Code Snippets