Bell Curve
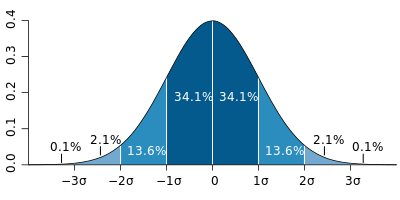
Standard Deviation
From: commons.wikimedia.org
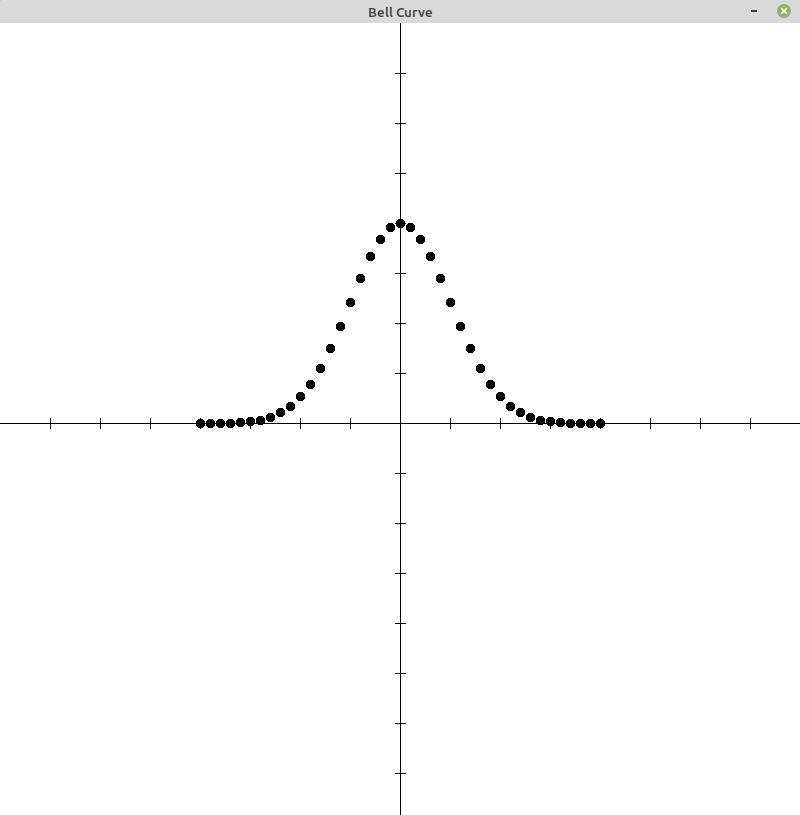
Project #1 - Plot a Bell Curve
Using graphics.py, plot a bell curve.
- plot X = -200 to 200 incremented by 10
- with YMAX = 200
- and a standard deviation of 50 (σ)
Vary these values and see what you get.
Are there other Python modules that can plot data?
Project #2
Create a file containing population data that is a bell curve. This file can act as population data when generating statistics. (see project #3)
- generate 1000 to 3000 data points
- data values should be integers
- data values should be one per line
What does random.normal() do?
What does numpy.random.normal() do?
What does scipy.stats.norm() do?
Project #3 - Mean (average) and Standard Deviation
Create an interactive program to
- ask the user for a population data file
- read population data from a file (see project #2)
- calculate the population's mean and standard deviation
- display the population's mean and standard deviation
- Loop...
- ask the user for a sample size
- create a random sample from the population
- calculate the sample's mean and standard deviation
- display the sample's mean and standard deviation
There are several Python modules that will generate the mean and standard deviation from a list of numbers. (see numpy)
Equation for the X,Y Coordinates of a Bell Curve
Y = Ke-(X-M)2/(2σ2)
| X,Y | are the curve's x,y coordinates (used for plotting, etc.) |
| K | is the maximum Y coordinate; used to scale the Y coordinates
(height in Y units) |
| M | is the curve's mathematical mean (X coordinate of the mean) |
| σ | is the curve's standard deviation;
determines how fat or skinny the curve is (width in X units) |
| e | is Euler's number; is a constant; is an irrational number (defined in the Python numpy module and other libraries) |
With this equation the user can:
- select what part of the curve to calculate; (used for plotting, etc.)
- set X coordinate for the curve's mean
- set maximum value of the curve's Y coordinates
- set how fat of skinny the curve is; standard deviation (in X units)
Mean
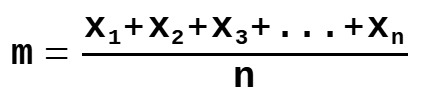 m = the population mean
n = the size of the population
x = each value from the population
m = the population mean
n = the size of the population
x = each value from the population
Standard Deviation
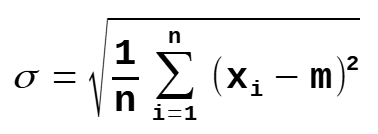 σ = population standard deviation
n = the size of the population
x = each value from the population
m = the population mean
σ = population standard deviation
n = the size of the population
x = each value from the population
m = the population mean
Python Examples
Useful Links
Formula for the Normal Distribution or Bell Curve
Note: This has a slightly different version of the equation.
Read the article for more information.
Standard Deviation (Wikipedia)
Normal Distribution (Wikipedia)
Standard deviation (simply explained) (YouTube)
FYI
Sometimes suspect/bad/outlier data can be part of a sample taken from a population.
For a method to eliminate outliers, click
HERE  .
.