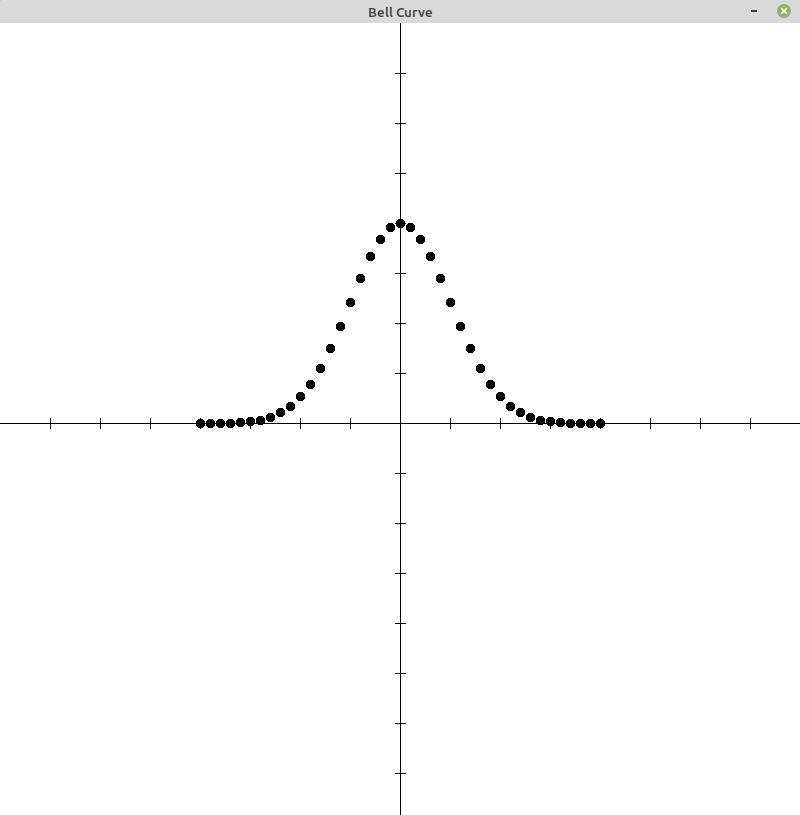
Bell Curve
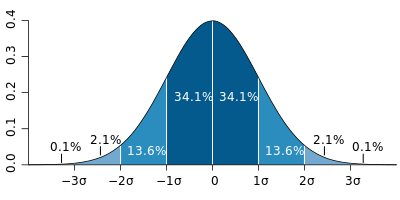
Standard Deviation
From: commons.wikimedia.org
Project #1
Use the Python Statistics Module
(Mathematical statistics functions
 )
)
- generate a list of random numbers
- value range: integers between 0 to 29 (inclusive)
- list size: 1000
- calculate and display the mean (average), median, and mode
- calculate and display the standard deviation (
σ ) (sigma)- How many values are within 1
σ of the mean?
What percentage of the total are they? - How many values are within 2
σ of the mean?
What percentage of the total are they? - How many values are within 3
σ of the mean?
What percentage of the total are they?
- How many values are within 1
Question: What is the difference between mean and average?
Project #2
Watch the YouTube video
Particle Physics Discoveries that Disappeared.
What is the significance of 5
Project #3
Repeat Project #1, but do not use existing modules or functions. Write your own. (See equations below.)
Project #4
Create a population of random numbers that are a bell curve. (size 1000?)
Calculate and display the population's mean, median, and mode.
- Select a random sample of 100 from the population
- calculate and display the sample's mean, median, and mode
- calculate and display the sample's standard deviation (
σ )- How many values are within 1
σ of the mean?
What percentage of the total are they? - How many values are within 2
σ of the mean?
What percentage of the total are they? - How many values are within 3
σ of the mean?
What percentage of the total are they? - What are the normal/theoretical percentages for a bell curve?
How does your sample compare?
- How many values are within 1
Project #5
Plot the mean of several samples from a population. (See Project #1 and Project #3)
- loop (100 times?):
- Get a random sample (100)
- Calculate the sample's mean value
- Add the sample's mean to a list of means
- Plot the means (histogram)
(make it pretty: plot title, axis labels, tick marks, ...)
I suggest you use the pyplot or related modules.
matplotlib.pyplot (documentation and examples)
(see matplotlib.pyplot.scatter(x, y))
Equation for the X,Y Coordinates of a Bell Curve
| Y = Ke-(X-M)2/(2σ2) | |
| X,Y | are the curve's x,y coordinates (used for plotting, etc.) |
| K | is the maximum Y coordinate; used to scale the Y coordinates
(height in Y units) |
| M | is the curve's mathematical mean (X coordinate of the mean) |
| σ | is the curve's standard deviation;
determines how fat or skinny the curve is (width in X units) |
| e | is Euler's number; is a constant; is an irrational number (defined in the Python math module as a constant: math.e) |
Mean
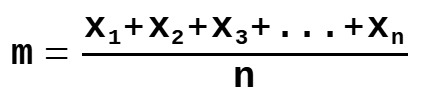 m = the population mean
n = the size of the population
x = each value from the population
m = the population mean
n = the size of the population
x = each value from the population
Standard Deviation
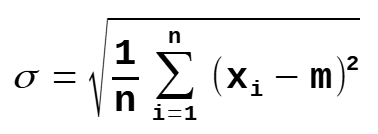 σ = population standard deviation
n = the size of the population
x = each value from the population
m = the population mean
σ = population standard deviation
n = the size of the population
x = each value from the population
m = the population mean
Generate a List of Random Number (sorted)
What must you do to generate the same random list over and over again? (Hint: seed)
Generate Random Values That Fit A Bell Curve
Click HERE
for "Non-Bell Curve Basic Statistics Examples".